More on the mathematics of ranked choice voting and majoritarian winners
Introduction
I previously wrote about “The Mathematics of Ranked Choice Voting” (RCV) for this blog, using simple, concrete examples to demonstrate how the RCV method is used to determine an election winner. In the surrounding discussion, I also illustrated some arguments made by proponents of using RCV in place of the more common plurality voting method (“vote for one”). One major point was that the plurality voting method does not gather nuanced information from the voters and, therefore, sometimes might not accurately reflect the preferences of the electorate:
And although those rules [for plurality voting] are simple and it makes it easy to calculate a winner, I would argue that this shoehorns voters into playing a game and prevents the entire system from accurately reflecting the will of the voters. How could that be fixed? The short answer is: ask for more information from the voters, then use it.
In this blog post, I’d like to focus on how the information provided by the voters gets used to identify a majoritarian winner in the ranked choice voting (a.k.a. instant runoff) method. Specifically, I will use a concrete example to illustrate the mechanics of the RCV method and then rebut a common argument made by opponents of RCV. I’ll conclude by briefly discussing some recent election results, including ballot measures about voting methods.
Reminder: How does ranked choice voting work?
If you haven’t yet read that previous blog post, I suggest doing so now! Either way, let’s see an example to remind ourselves of the key steps of the RCV method. Suppose we have 290 voters in an election with four candidates: P, G, B, and H. (The meaning behind these letters will be revealed later in this post.)
Each voter is asked on their ballot to rank the candidates in their order of preference by indicating a 1st choice, a 2nd choice, and so on. Importantly, a voter is not obligated to rank more than one candidate: it’s entirely their choice. For instance, I might submit a ballot indicating H 1st and B 2nd. Or, I might indicate only H 1st, with no further rankings. Or, I might rank them all: H 1st, B 2nd, G 3rd, and P 4th.
The RCV method begins by looking at every voter’s 1st place ranking and asking: Does some candidate have a majority (more than 50%) of those votes? If so, that candidate wins and the process is complete.
Let’s make this example concrete: suppose the 1st place rankings submitted by the 290 voters are distributed according to the table below. For convenience, I have also stated the corresponding percentages (e.g., 134 out of 290 voters ranked candidate P 1st, and 134/290 ≈ 46.21%). Soon enough, as it’s needed, we’ll add more information about 2nd place rankings and beyond; for now, though, we’re focused on the 1st place rankings.
| # of voters: | 134 | 132 | 17 | 7 |
| 1st choice: | P | G | B | H |
| % of total: | 46.21 | 45.52 | 5.86 | 2.41 |
Notice that the leading vote-getter is candidate P, yet 46.21% is not a majority. Therefore, the next stage of the RCV method kicks in: the candidate with the fewest 1st place votes is eliminated, and any voter who ranked that candidate 1st will have their voting power transferred down to their 2nd choice.
In our example, this means candidate H is removed from the running. Moreover, each of those 7 voters who listed H as their 1st choice will now have their 2nd choice count instead, if they exercised their option to list one. Remember: voters are not obligated to rank more than one candidate! It’s entirely reasonable for a voter to use their ballot to say: “I want candidate H to win, but amongst the other three candidates, I do not have strong enough preferences to rank one higher than the other.”
To continue our concrete example, suppose that those 7 voters’ 2nd place rankings look like this:
| # of voters: | 134 | 132 | 17 | 4 | 2 | 1 |
| 1st choice: | P | G | B | H | H | H |
| 2nd choice: | ? | ? | ? | B | P | – |
Notice the column of 7 voters split into three columns now, showing that 4 voters ranked H 1st and B 2nd, 2 voters ranked H 1st and P 2nd, and 1 voter merely ranked H first. That is, the dash (“-”) in the final column indicates a ranking that was left blank. By contrast, those question marks (“?”) elsewhere in the table indicate that we don’t yet know what those 2nd choices are because the RCV method has not needed to use them.
We now ask the same question as before: Does some candidate have a majority of votes? This time, though, we’ll combine 1st choices (from the first few columns) and 2nd choices (from the last few columns where H had been ranked 1st): candidate P has 134+2=136 votes, candidate G has 132 votes, and candidate B has 17+4=21 votes. We must also incorporate the fact that there are now only 289 voters in the electorate (136+132+21=289) because one voter’s ballot (the far right column) has been exhausted: the preferences expressed on that ballot have been “used up” and will not influence the remainder of the process. (It’s important to note that this voter does not have “less voting power” than the others! Their ballot effectively says: “If I can’t have candidate H, then I’ll let y’all decide amongst the other three.”) Ultimately, we find that the leading candidate is P, but their vote share is still short of a majority: 136/289 ≈ 47.06%. Hence, we move on to another runoff by eliminating candidate B, who had the fewest votes in this round.
| # of voters: | 134 | 132 | 5 | 3 | 3 | 2 | 2 | ||||
| 1st choice: | P | G | |||||||||
| 2nd choice: | ? | ? | G | – | P | – | |||||
| 3rd choice: | ? | ? | ? | G | P | – | – | G | – | ? | – |
In this table, I’ve continued to use a dash “-” to mean “ranking left blank” and a question mark “?” to mean “ranking unknown (not yet needed).” Furthermore, bold text indicates votes that count in this round, while strikethrough text indicates an eliminated candidate or an exhausted ballot. Indeed, notice there are 9 exhausted ballots, where a voter ranked only the eliminated candidates (just B, just H, or just B and H) but did not rank either of the continuing candidates (P or G). Effectively, those 9 voters used their ballots to say: “We want either B or H to win, but if it comes down to P vs. G, we’ll let y’all decide.” And what is that decision, with P vs. G? Well, we find 134+3+2=139 votes for candidate P and 132+5+3+2=142 votes for candidate G, giving G the majority: 142/281 ≈ 50.5%.
This example illustrates some key features of the RCV method. It continually looks at “top rankings” to find a majoritarian winner, but as candidates are eliminated one-by-one, the “top” of a voter’s ballot in later rounds may be their 2nd or 3rd choice, or beyond. Meanwhile, some voters’ ballots become exhausted in the process when their preferences get entirely “used up” in earlier rounds and do not carry through to later rounds. (Again, this is not a problem with the method; in fact, it’s notable that voters are able to express these nuanced opinions about the candidates and have those preferences factored in at all, unlike the more common “vote for one” method.) Accordingly, the threshold for what counts as a majority may change as the runoff rounds occur. Finally, we saw how the leading vote-getter in the first round may end up losing in the final runoff by not being ranked highly (or at all) on the ballots of voters who had listed a less popular candidate as their 1st choice.
Example: US House, Maine District 2, 2018
In 2016, the voters of Maine passed a ballot measure calling for RCV to be used in future statewide primary and general elections. In response, the state legislature attempted to delay enactment of the measure, prompting a prolonged legal battle involving the state supreme court and petitions for a “people’s veto.” (Ballotpedia has more information about this process: “Maine’s ranked-choice voting law: adoption, implementation, and challenges.”) The RCV method was finally used officially in 2018, marking the first time RCV had ever been used in an election for United States Congress. Not only that, but in one race that year, the RCV method made a difference in the results: the plurality vote winner (the leading vote-getter in the 1st round) ended up losing in the final runoff.
Check out the screenshot below (from Ballotpedia) of the results from the election for Maine’s District 2 in the U.S. House of Representatives. What do you notice? It seems improbable that the two Independent candidates received literally zero votes in this election. Indeed, what we’re seeing are the final results from the last runoff round, after conducting the RCV procedure. But also, look at the final totals: ≈142,000 to ≈139,000. Do those results sound familiar?
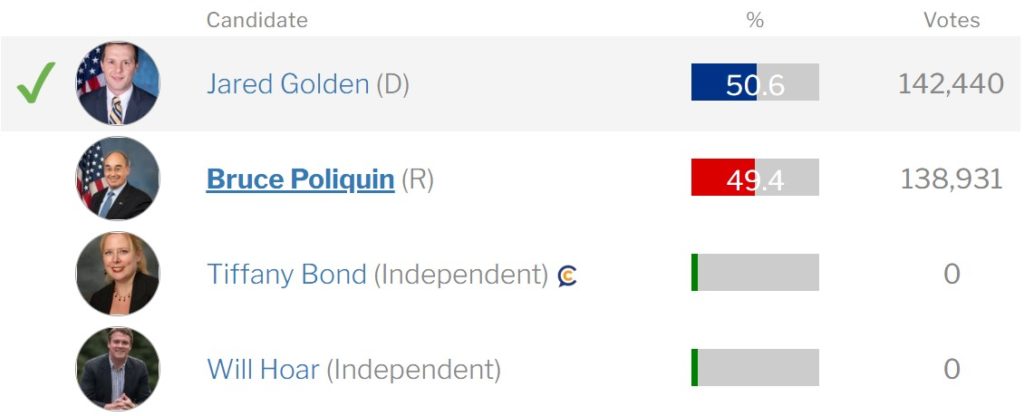
That’s right: the mock example we investigated in the previous section was entirely based on this real election! The candidates are P = Poliquin, G = Golden, B = Bond, and H = Hoar. To make the analysis simpler, I reduced all vote counts by a factor of 1,000 and rounded to whole numbers (hence our final result of 142 to 139, for instance).
Majority of all ballots vs. continuing ballots
I’d like to now use this example to make a point about the RCV method and what constitutes a majoritarian winner. Specifically, we must consider the difference between a majority of all ballots originally cast in the first round of the election and a majority of the continuing ballots that were not exhausted during the runoff process.
In our mock example, we found that candidate G won with 142 votes from the 281 continuing ballots, although there were 290 ballots originally cast. This means that G had a 50.5% majority (142/281) of the continuing vote but only 48.97% (142/290) of all original votes, which is not a majority. How is this possible? Because of those 9 voters who only ranked B or H (or both) but did not list G or P on their ballot at all. Indeed, we can think of the final round as split among three “candidates,” where G has 48.97% (142/290), P has 47.93% (139/290), and the exhausted ballots account for the remaining 3.10% (9/290).
Compare those values from our mock example with the actual results from that 2018 election in Maine, which are shown in the table below from Wikipedia:
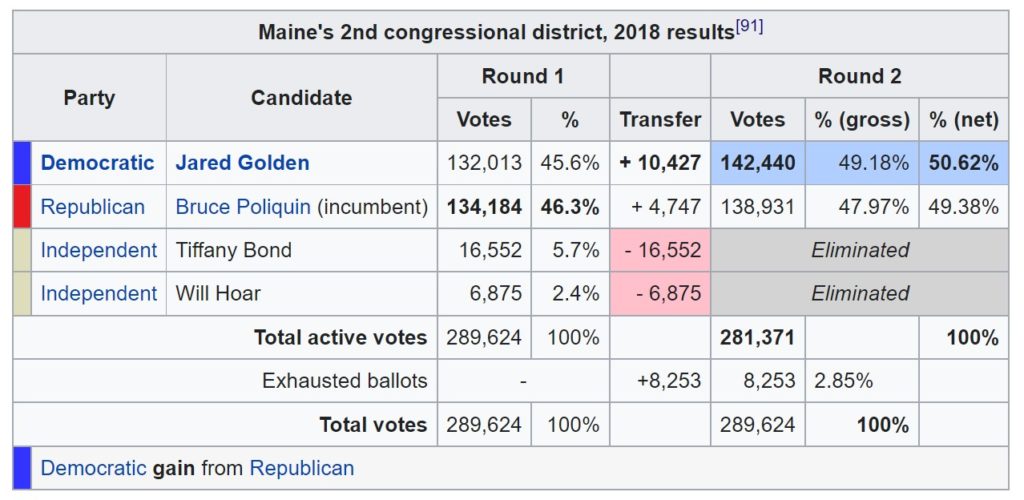
Notice that the breakdown of 1st place rankings is similar to what we used: 134 to 132 to 17 to 7. And notice the column labelled transfer: it roughly matches what occurred in our runoff rounds, where candidate G picked up 5+3+2=10 votes and P picked up 3+2=5 votes, in total.
One significant difference is that we saw those transfers occurring over two rounds: we eliminated H first, and then B. However, it appears that there was only runoff round in the actual election. (Note the headings: Round 1 and Round 2.) This is because the two Independent candidates collectively received only 5.7%+2.4%=8.1% of the 1st place votes. So, in practice, both Bond and Hoar can be eliminated all at once because it is mathematically impossible for Bond to pick up enough transfer votes from Hoar to advance to a further round.
Now, I didn’t do that in our previous example simply because I wanted to illustrate the RCV method in full detail. Consequently, I had to make assumptions about what the 2nd and 3rd place rankings would be on the ballots of voters who initially ranked Hoar or Bond 1st. This is what we saw when those columns labelled 7 and 17 were broken down further and used in the runoff rounds. I am not saying that my assumptions were perfectly accurate, but they at least reasonably match the number of exhausted ballots, which is the only information that’s publicly available anyway. (The official results from Maine’s Secretary of State do not provide a breakdown of 2nd or 3rd place rankings.) We saw 9 ballots get used up in our example, and the table here states that 8,253 ballots were exhausted in the 2018 Maine election.
Accordingly, this real election illustrates a phenomenon just like our mock example, where (i) the leading vote-getter in the first round eventually lost in the runoff, and (ii) the ultimate winner received a majority of continuing votes but not a majority of all votes cast. To see that distinction, look to the % (gross) and % (net) columns in the table above: Golden received 50.62% of the continuing vote but only 49.18% of all votes. Or, as it’s stated on Wikipedia: “Including exhausted votes, the final count was Golden 49.2%, Poliquin 48.0%, and 2.8% exhausted.”
Why this matters: a common argument against RCV
You may wonder why I’ve been analyzing this specific example in such detail. Well, I’m a mathematics educator who is especially interested in helping people understand these issues, and I know that applying mathematical reasoning in an authentic, real world context is an excellent way to hone our critical-thinking and quantitative literacy skills, in general. But, more importantly, I worry that opponents of ranked choice voting will continue to cite examples like this one to argue that RCV “fails” to elect a majoritarian winner, which is just not true!
I can substantiate this worry with documented evidence: the Information For Voters provided by the Massachusetts Secretary of State in 2020. When we have ballot questions to vote on, these booklets are mailed to residential addresses to share information about the content of the ballot questions, what the consequences might be, and some arguments for and against them. In 2020, Massachusetts voted on Question 2, a proposal to enact ranked choice voting in our statewide elections, similar to what Maine had passed in 2016. So, that year’s booklet contained a written argument against adopting RCV, provided by an organization called the Massachusetts Fiscal Alliance, which concluded with this paragraph:
“Ranked Choice Voting ballots force voters to guess the candidates who will remain standing in multiple voting rounds and cast their votes in the dark. If they guess wrong and vote for eliminated candidates, their ballots are not counted in the final vote. Winners win a false ‘majority’ of remaining ballots, not a true majority of all the voters voting in the election.”
As the booklet states, these arguments “are written by proponents and opponents of each question, and reflect their opinions. The Commonwealth of Massachusetts does not endorse these arguments, and does not certify the truth or accuracy of any statement made in these arguments.”
I think we are now prepared to assess the truth and accuracy of that statement! Review our mock example from earlier, as well as the results from the 2018 Maine election. Do you think that candidate G (Golden) received a “false majority” of votes? In what sense? (And which candidate would have received a “true majority” in that election? Nobody had a majority of votes in the first round anyway! Does that organization think this election should have declared… no winner?!)
Keep in mind that the Maine election had just happened in November 2018 and it was followed by a legal battle over the results, with Republican candidate Bruce Poliquin contesting – after the election had already happened – that the RCV method was unconstitutional. (See Ballotpedia for more information about this “Election aftermath.”) So, in the leadup to voting on Question 2 in 2020, I wonder if the Massachusetts Fiscal Alliance was hoping some voters would be vaguely aware of “that messy RCV thing in Maine” and might, therefore, be more easily persuaded by their written “argument” that slyly casts doubt on the legitimacy of RCV. It’s especially telling, in my eyes, that they attempt to rebut one of the most important points cited by proponents of RCV. Indeed, the corresponding written argument made by Voter Choice Massachusetts on the very same page of that 2020 Information for Voters booklet states: “Ranked choice voting ensures the winner has majority support and reflects the true will of the people.”
So, who are we to believe? Was Golden’s victory a majority or not? Does RCV elect majoritarian winners or not? I’ll let you make your own decision, but whatever you do, don’t ignore the fact that, in the Maine 2018 election, over 8,000 voters chose to rank one or both Independent candidates but did not rank either of the major party candidates on their ballot at all. That is, a small but significant number of voters (2.8% of all ballots cast) used their RCV ballot to express a nuanced opinion that was previously impossible in the “vote for one” system: they want an Independent candidate but, when faced with a hypothetical choice between the two major party candidates, they would likely stay home instead! By not ranking Golden or Poliquin anywhere on their ballot, they implicitly said, “I do not wish to express a preference for one of those candidates over the other. If the race comes down to those two, the rest of y’all can decide.”
I think it’s perfectly reasonable to say that Golden earned a majoritarian victory. Setting aside all those exhausted ballots – as if those voters had simply sat out a typical race between the two major parties – we have the final result of Golden’s 50.62% to Poliquin’s 49.38%. To interpret this as less than a majority, one must conveniently ignore what those 8,000+ voters were trying to say with their ballots.
In short, those voters were not guessing “in the dark” about who would get eliminated and their votes were absolutely counted in the process. To say otherwise demonstrates either a profound misunderstanding of how RCV works or else an obvious desire to mislead the general public. And neither of those is a good look. Whatever the motivation, though, that misstatement by the Massachusetts Fiscal Alliance seems to have worked, unfortunately: Massachusetts rejected Question 2 in 2020 by a count of 51% to 43%, with 6% of ballots left blank.
RCV in recent and future elections
I’ll conclude this post with a discussion of another recent election that used RCV, as well as some current ballot questions pertaining to voting methods outside the typical “vote-for-one” system.
Alaska: August 2022 US House special election
At the same time Massachusetts voted against a ballot question on RCV in 2020, Alaska passed one of their own: 2020 Alaska Measure 2. Now, their statewide elections use an open primary system, where all candidates run at once (instead of primaries conducted by individual political parties, like we do here in MA). That primary uses the “vote for one” method, and the top four vote-getters regardless of their party advance to the general election, where the RCV method is used instead.
When former U.S. House Representative Don Young passed away in March 2022, Alaska needed to conduct a special election to fill this vacancy. State election officials had already been preparing to use the new “open primary + RCV general” election method for the first time later in the year (primary in August and general in November), but now they had to conduct a special primary and general election using this new method. Impressively, they pulled this off on short notice while simultaneously conducting a widespread, new vote-by-mail campaign. (Check out some episodes – from May and June – of the podcast RCV Clips for more information about this.)
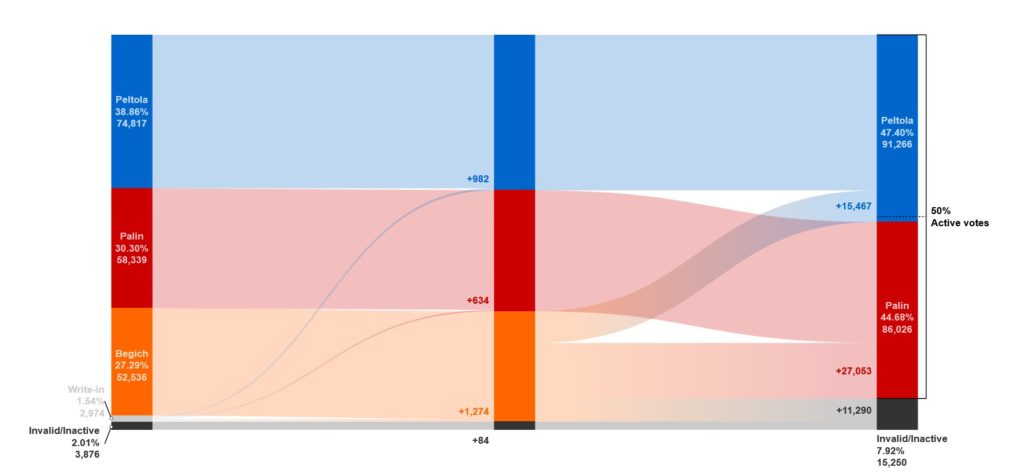
The primary election on June 11 yielded Sarah Palin, Nick Begich, Al Gross, and Mary Peltola as the top four vote-getters. About a week later, Al Gross withdrew his candidacy, leaving Palin, Begich, and Peltola as the three candidates in the general election, held on August 16. (Notably, this was the same day as the primary election for the standard 2022 general election, so voters could easily participate in both.) In that general election, the RCV method was used which, as we’ve seen before, allows voters to express more nuanced preferences than the traditional “vote for one” method. Indeed, an obvious message from the final results is that a significant number of voters ranked Begich (a Republican) 1st but did not rank Palin (also a Republican) 2nd.
Check out the table of results on Wikipedia, similar to what we analyzed in the Maine 2018 example. Notice that Begich received the fewest 1st place rankings, so he was eliminated first. Of his 52,536 votes, a little more than half went to Palin in the next round. However, these results also reveal that many Alaskans “just don’t like Palin,” because “about 28 percent ranked Peltola second and another 21 percent didn’t give Palin their second-place votes.” (Source: “What Peltola’s Win Can Teach Alaska (and America)” from Sightline Institute.) For a visual depiction of this phenomenon, check out the “flow diagram” below. Moving from the 2nd column to the 3rd, the value “+15,647” indicates how many 1st place votes for Begich got transferred to their 2nd choice of Peltola, and the value “+11,290” shows how many Begich supporter’s ballots were exhausted, meaning they did not list either Palin or Peltola as a 2nd choice. Any discussion of this election that does not confront that phenomenon is glossing over an important message from the voters of Alaska!
The standard general election for this U.S. House seat just happened on Tuesday, November 8, 2022. The results are still being analyzed, so keep an eye out for how the RCV procedure is applied, what the rankings and exhausted ballots might be saying about the preferences of the electorate, and how the media and the general public are engaging with these topics.
Ballot measures: open primaries, RCV, and approval voting
Finally, let’s briefly consider a few of this year’s ballot measures about “alternative voting methods.” (See FairVote’s website for a full list.)
As of this writing, with 90% of the votes in, it appears that Nevada is poised to pass Question 3 by a narrow majority. This will establish a statewide electoral system just like the one now used in Alaska; the only difference is that vote-for-one open primaries will send the top five vote-getters through to the general election, instead of four. I find it interesting that Alaska and Nevada incorporated changes to their primary system as part of these ballot measures, unlike in Maine. Moreover, Alaska’s ballot measure also included reforms to campaign finance laws, perhaps demonstrating that voters see all of these issues as intertwined. If any states propose RCV-related ballot measures in the near future, I wonder whether they will also include other structural changes to their electoral systems.
Meanwhile, there are several local ballot measures this year, as well. A noteworthy example is in Seattle, WA where a pair of ballot measures asked voters two things:
- Should we change our voting method from “vote-for-one” to something else?
- If the answer to (A) is Yes, then what should that something else be: ranked choice voting or approval voting?
To me, the format of these ballot measures is already interesting because the result of the second question is entirely unnecessary if the result of the first question is No! I believe it would be more efficient to have one question that asks voters to rank the three options: retain current vote-for-one method, switch to ranked choice voting, switch to approval voting. Of course, using those rankings to decide a winner would require implementing something other than the vote-for-one method, and this is precisely what voters are deciding on with these propositions, so… I acknowledge that this is not technically possible. But doesn’t it make more sense? Moreover, publicly sharing and analyzing the results would likely yield a more productive discussion about what the Seattle electorate truly wants because ranking the options would allow the voters to express more nuanced opinions than simply Yes/No. In any event, it appears that the voters have narrowly answered “Yes” to the first question, while resoundingly answering “ranked choice voting” to the second question! A local Seattle news station reports that roughly 50.9% of voters were in favor of changing the voting method to something else; and, as for what that new method will be, 75% favored RCV while only 25% favored approval voting.
Elsewhere, several local ballot measures will see the RCV method used in future municipal elections. For example, as of this writing, it appears that such ballot measures passed in Portland, Maine; in Portland, Oregon; in Fort Collins, Colorado; in Ojai, California; and in a few other cities and counties.
Conclusion
I hope this blog post has given you a better understanding of a subtle but significant aspect of the ranked choice voting method: finding a majoritarian winner. By carefully analyzing a few concrete examples, we have seen not only how this works, in context, but also how opponents of RCV attempt to sow confusion and cast doubt on this aspect of the method. I encourage you to keep an open mind about these issues and do some critical thinking and analysis yourself.
I also hope you’ve seen how all of this requires some basic but essential quantitative reasoning skills. We often had to work with large numbers and percentages, and there’s just no way around that! There’s no magical, mathematical formula that will help us perfectly understand all of these issues and “solve” voting. Instead, it’s incumbent on all of us to be well-informed and to apply patient, logical analysis. (This is especially true because there are sometimes mathematical issues hiding in an otherwise seemingly political discussion, like that claim about a “false majority.”)
For those of you here at Emmanuel College, please consider enrolling in MATH 1105 Mathematical Reasoning for Modern Society! In that course, we develop these essential critical-thinking skills and practice applying them to current events, including lots of examples about voting and elections.
And for everyone, please check out my book, An Introduction to the Math of Voting Methods (619 Wreath, 2022), to learn more about how ranked choice voting, approval voting, and other voting methods are used around the world.
 About Emmanuel